01
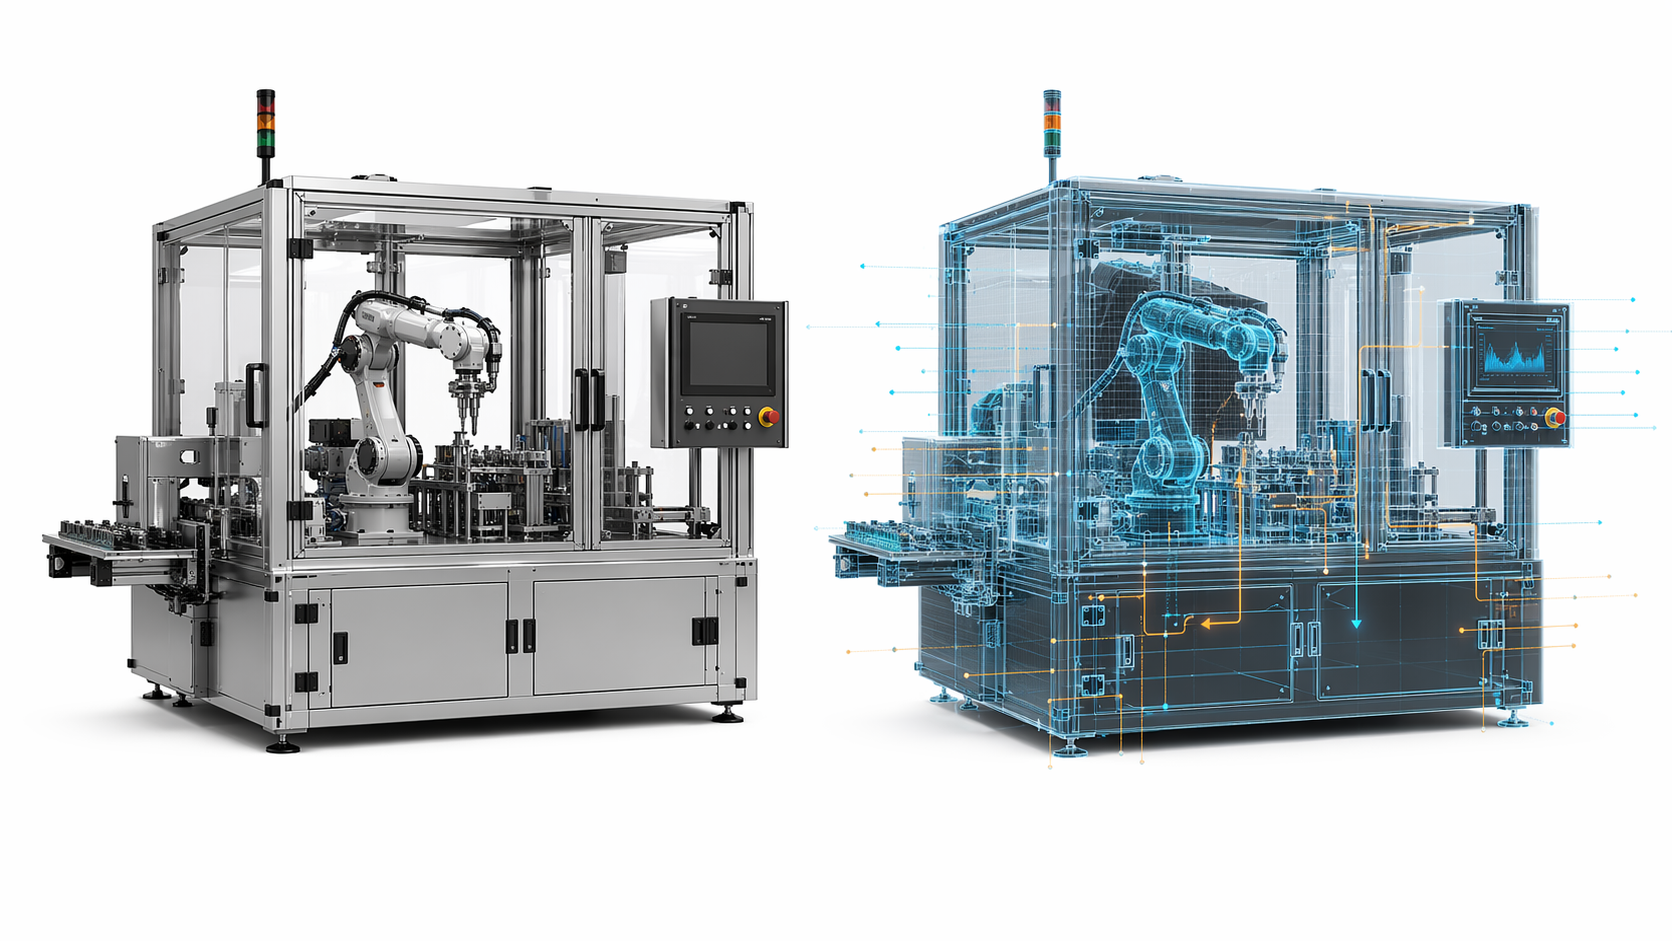
Connect your digital twin to live data sources and watch your 3D model respond instantly. Visualize sensor readings, equipment status, and operational metrics directly on your 3D asset. Color-code components based on temperature, pressure, or any data point.
- Live sensor data integration
- Dynamic color-coded status indicators
- Real-time parameter updates
02
Connect your digital twin to any data source through our flexible API. Pull data from IoT platforms, SCADA systems, databases, or custom endpoints. Use spreadsheet formulas to transform and display data exactly how you need it.
- REST API connectivity
- IoT platform integration
- Spreadsheet-based data transformation
03
Go beyond flat dashboards with fully interactive 3D views of your assets. Rotate, zoom, and click on components to see detailed information. Create multiple camera presets for different monitoring scenarios.
- 360° interactive viewing
- Click-to-inspect components
- Custom camera presets
04
Use your digital twin to simulate scenarios before implementing them in the real world. Test different configurations, predict outcomes, and optimize operations without risking your physical assets.
- Parameter-driven simulations
- What-if scenario testing
- Optimization modeling
05
Deploy your digital twin on any platform. Embed it in your existing monitoring dashboards, internal tools, or customer portals. Share live views with stakeholders through simple iframe embedding or our JavaScript API.
- Iframe embed for any website
- JavaScript API for custom integration
- Mobile-responsive 3D views
06
Build sophisticated digital twins without programming. Use our familiar spreadsheet interface to define geometry, map data to visual properties, and create interactive behaviors. Update your twin as easily as editing a spreadsheet.
- Excel-like interface
- Visual data mapping
- Instant preview updates